Beginner traders often get excited when they discover Candlestick trading. The charts offer a lot of information, are color-coded, and seem relatively straightforward to use compared to other trading ...
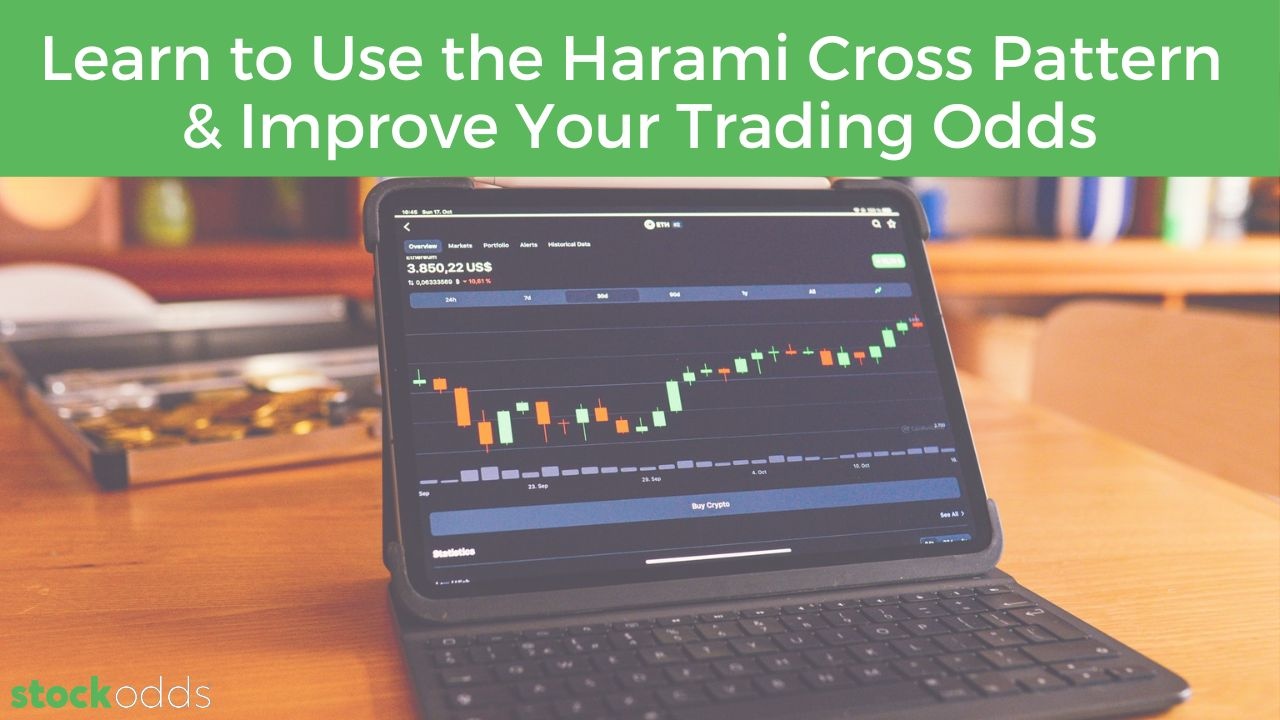
Every trader has seen the charts with different colored bars and lines — but what do they mean as a pattern, and how can you, the astute trader, use them to boost your Odds? As it turns out, there’s a...

UPDATE: the actual performance of this trading basket, on a capital-balanced basis, was +3.05% ROC for the day.
|
Symbol |
Action |
July 29 Close |
August 1 Close |
Return |
| ... |

UPDATE: the actual performance of this trading basket, on a capital-balanced basis, was +1.13% ROC for the day.
|
Symbol |
Action |
July 28 Close |
July 29 Close |
Return |
|
E... |

There are plenty of common momentum indicators that focus on oscillation, such as RSI. Now, it’s time to wade a little deeper into the indicator world and take a peek at MFIs — short for Money Flow In...

UPDATE: the actual performance of this trading basket, on a capital-balanced basis, was +0.88% ROC for the day.
|
Symbol |
Action |
June 30 Close |
July 1 Close |
Return |
|
NF... |

UPDATE: the actual performance of this trading basket, on a capital-balanced basis, was +0.62% ROC for the day.
|
Symbol |
Action |
June 29 Close |
June 30 Close |
Return |
|
N... |

UPDATE: the actual performance of this trading basket, on a capital-balanced basis, was -0.58% ROC for the day.
|
Symbol |
Action |
May 31 Close |
June 1 Close |
Return |
|
LUL... |
